![]()
Tablet terminal software for
supporting rehabilitation
![]()
TRACE CODER
Upper limb function coordination evaluation device using a tablet computer
There is an examination of an upper limb coordination evaluation as to whether the patient traces the pattern of the geometric system printed beforehand and how much of the figure can be drawn following the original pattern.The “Trace Coder ™” we proposed was developed to make this test software and measure it using a tablet terminal. It supports the evaluation of upper limb coordination in all aspects, including the analysis of data measurement and scoring, the immediate presentation of examination results to patients, etc.
Benefits of the Trace Coder
Benefits for medical staff
-
It is possible to follow rehabilitation progress on the spot.
Due to its easy recall of historical data by patient, rehabilitation follow-up based on progress can be done on the spot which will be helpful to direct future steps for every new inspection.
-
This reduces the time and effort to measure.
It was troublesome and time consuming to obtain the deviation width from the original figure using the conventional inspection that traces the figure printed on the paper. Using this product, it is possible to shorten the time greatly by automatically calculating the deviation width from the basic figure.
-
Quantitative evaluation using the tablet terminal is possible.
By changing paper management to data management, we can easily save, browse, and recall the inspection result and conduct objective quantitative evaluations.
Benefits for patients
-
Validation results can be quantified and confirmed immediately on the spot
By changing paper management to data management, we can easily save, browse, and recall the inspection result and conduct objective quantitative evaluations.
-
Because we can immediately check it, motivation is improved.
Being able to check the changes in the total score immediately leads to improvement in patient motivation.
Product Specification
| OS | Windows10 pro |
|---|---|
| Size | 275mm x 173mm x 14mm |
| Weight | 907g |
| Resolution | 10.6in / 1920 x 1080 |
| Option | Camera・Numeric keypad・Server system |
Inspection types
-
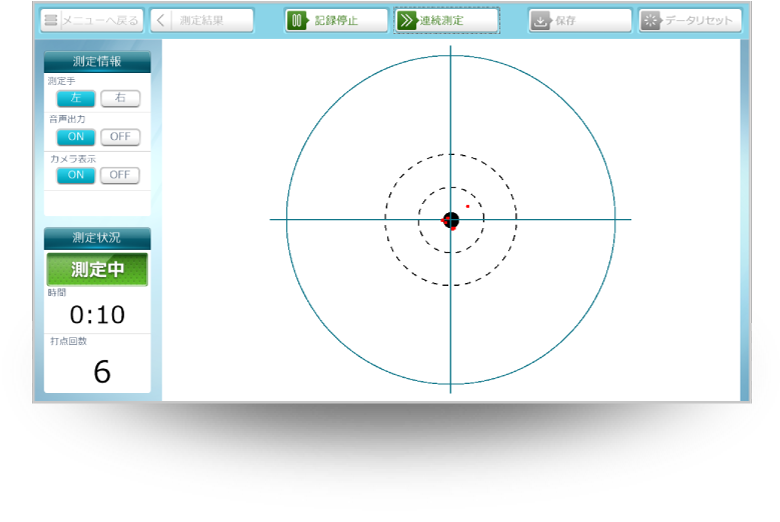
Weld point inspection
It is an inspection to calculate the divergence width between input coordinates and the center of the circle by lowering the pen from 10 cm above directly toward the center of the reference circle.
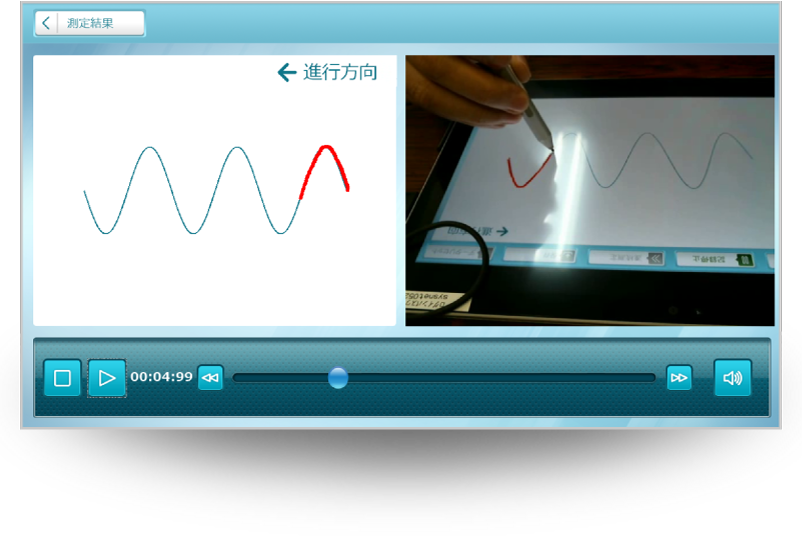
-
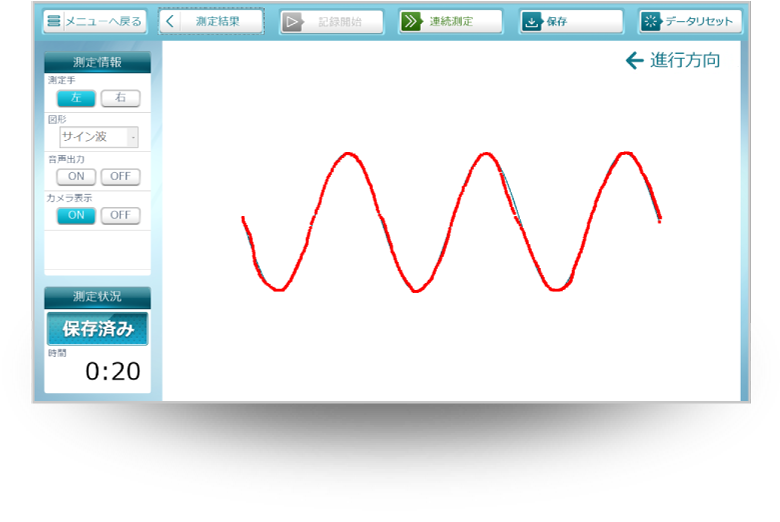
Trace inspection
It is an inspection to calculate a divergence in width between the baseline and input coordinates in which a subject selects an arbitrary graphic from a baseline (straight line, square wave, sine wave, triangular wave, circle),and traces the baseline with a pen.
-
Wire drawing inspection
It is an inspection that connects two straight lines drawn vertically.
It mainly inspects measurement failure.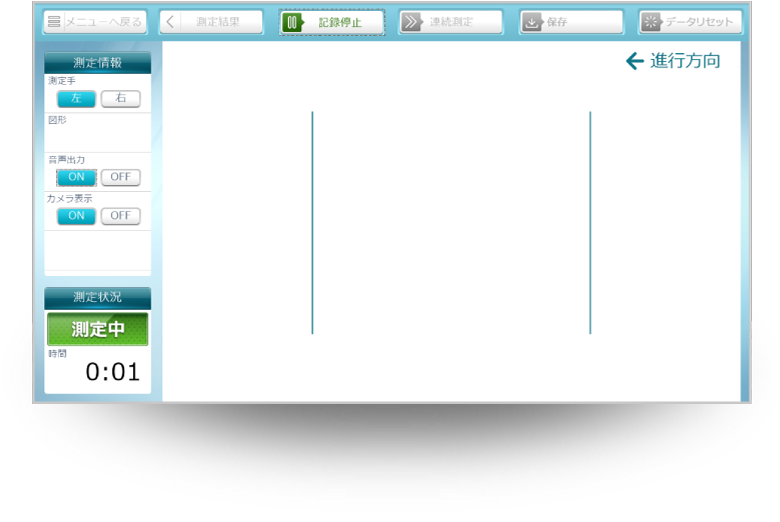
-
Indicator tracking inspection
Select any shape from the baseline (straight line, square wave, sine wave, triangular wave, circle).
It is an inspection to calculate the divergence width between the moving body marker which moves on the selected baseline at about 10 mm per second and the input coordinates by tracing the baseline so that the subject follows the moving body marker.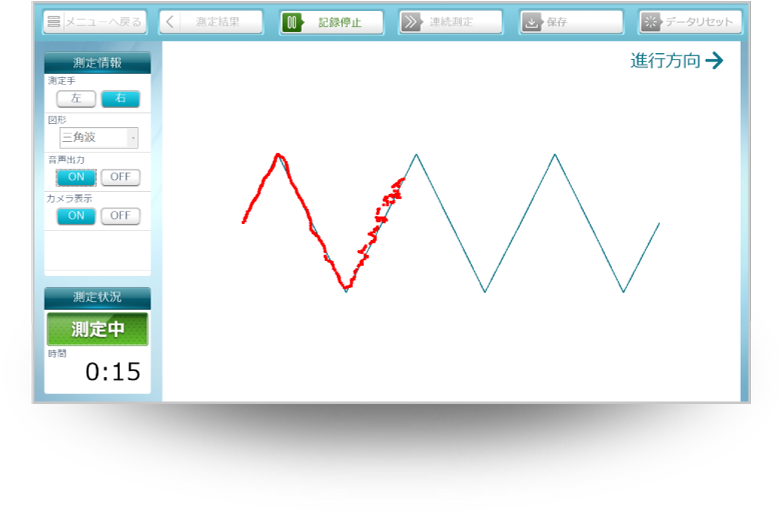
Inspection Result
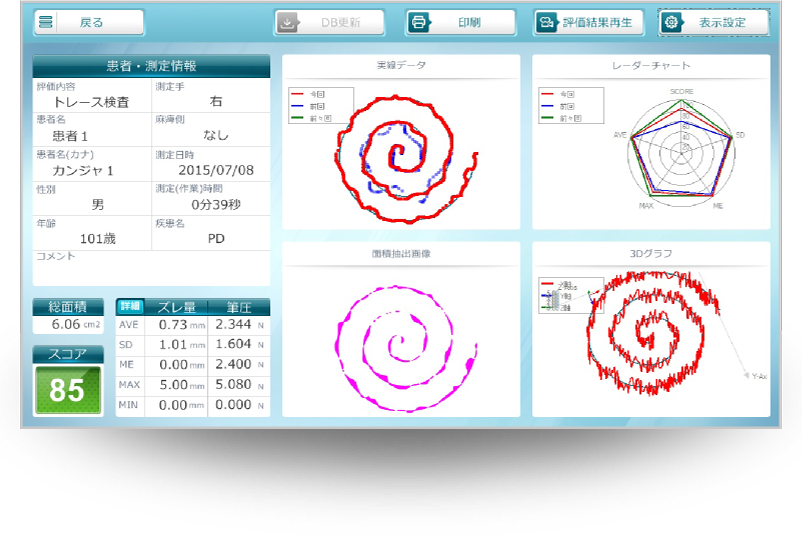
The inspection result will be displayed right after the inspection on the result screen.
In addition to saving the inspection result data and digitizing the maximum divergence, because the inspection result is also displayed in a divergence time series graph, histogram, and radar chart patient trends are understood at a glance.
It is possible to perform multidirectional evaluations based on the accumulated data from each inspection. Presenting the results to patients immediately will increase their motivation for rehabilitation.
| Divergence width time series graph | Graph with time as the X-axis and divergence width as the Y-axis |
|---|---|
| Histogram | Visual representation of divergence variation using a histogram. |
| Frequency analysis | Representation of the trend of divergence using Fourier conversion |
| Time series graph for writing pressure | Representation of the amount of writing pressure input from the dedicated stylus |
| Cumulative divergence width ratio | Graph obtained by integrating divergence ratio |
| Radar chart | Standard deviation, median value, maximum value, average value, and score of divergence are displayed in a radar chart format making comparisons easy. |
Because the information is compiled into a database, it is easy to save and recall the data for each patient.
Also, when conducting new inspections, new test auxiliary input using past data, auxiliary input using just touch selection, etc. allows the simplification and efficiency of operations.
Because it is an inspection using a tablet terminal, it is easy to carry and handle for the patients. For example, it can perform inspections beside hospital beds and other locations outside the clinic room.
Manufacturer: System Network
2-18 9F, Daiyujicho, Kita ward, Osaka city, 530-0051 Osaka
TEL +81-6-6364-0529
FAX +81-6-6364-2759
